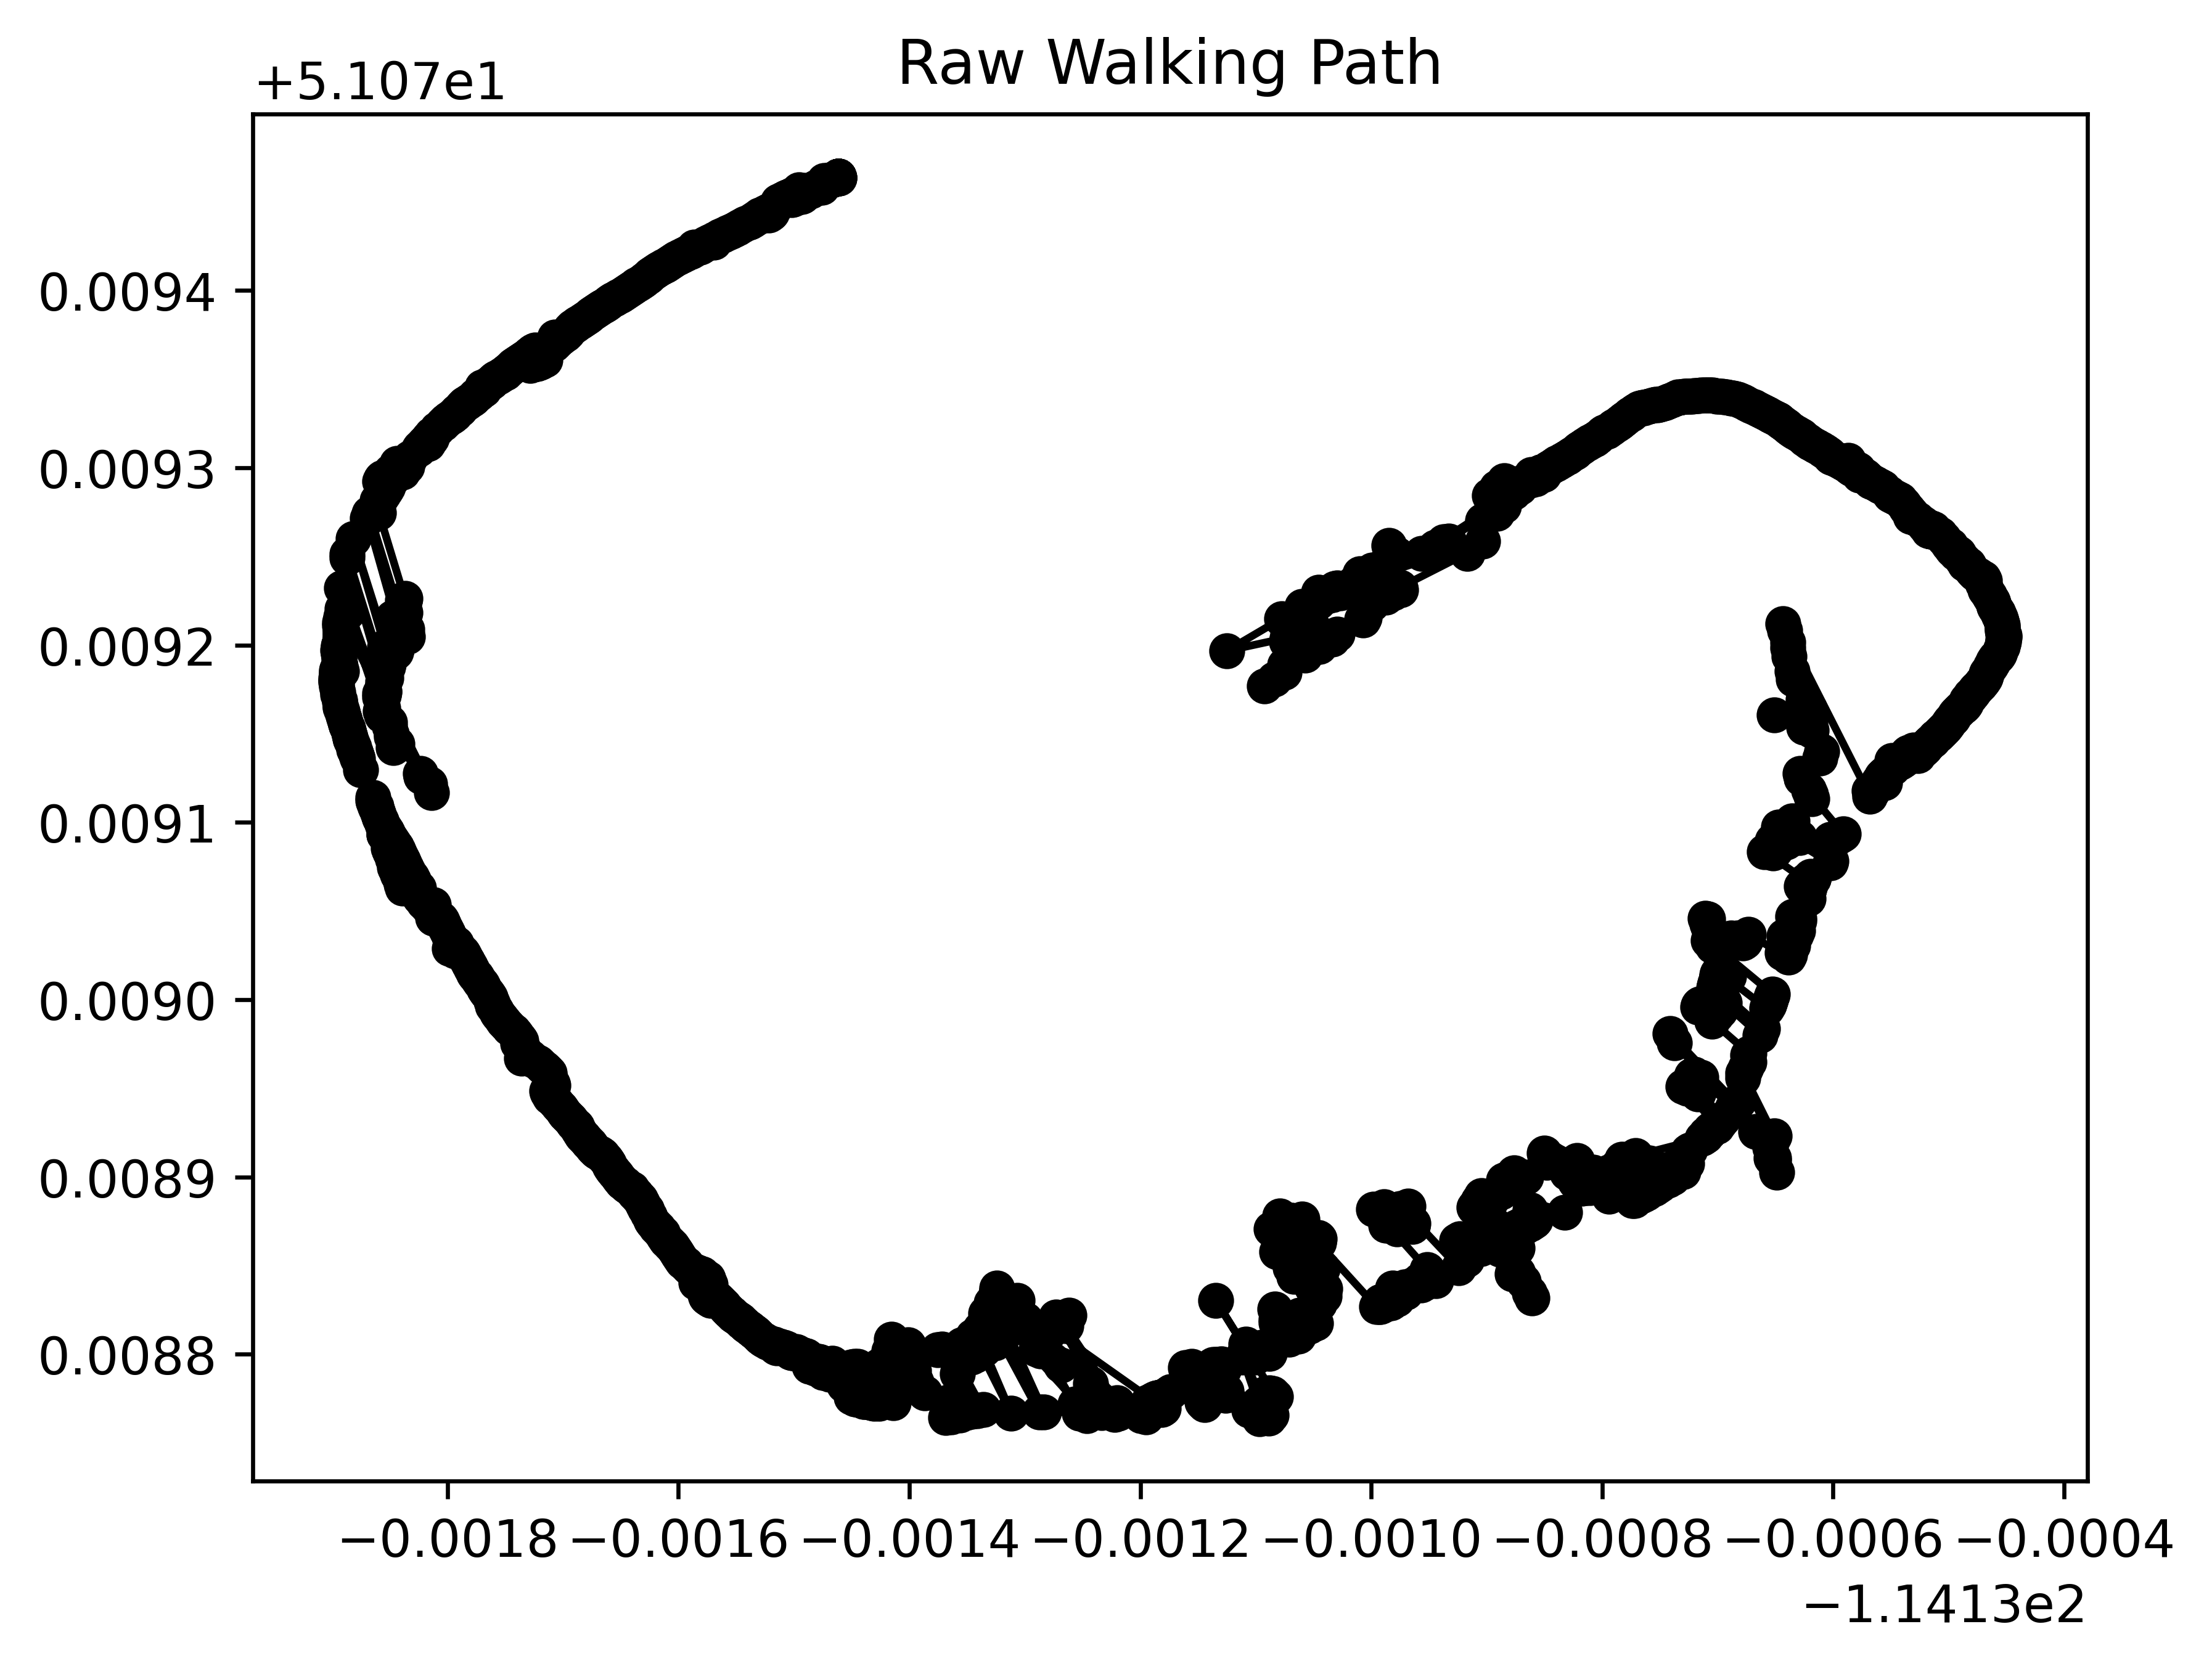
Raw data plot showing the recorded surveying path without applying any smoothing methods. each point is connected by a line to show the path or direction of errors.
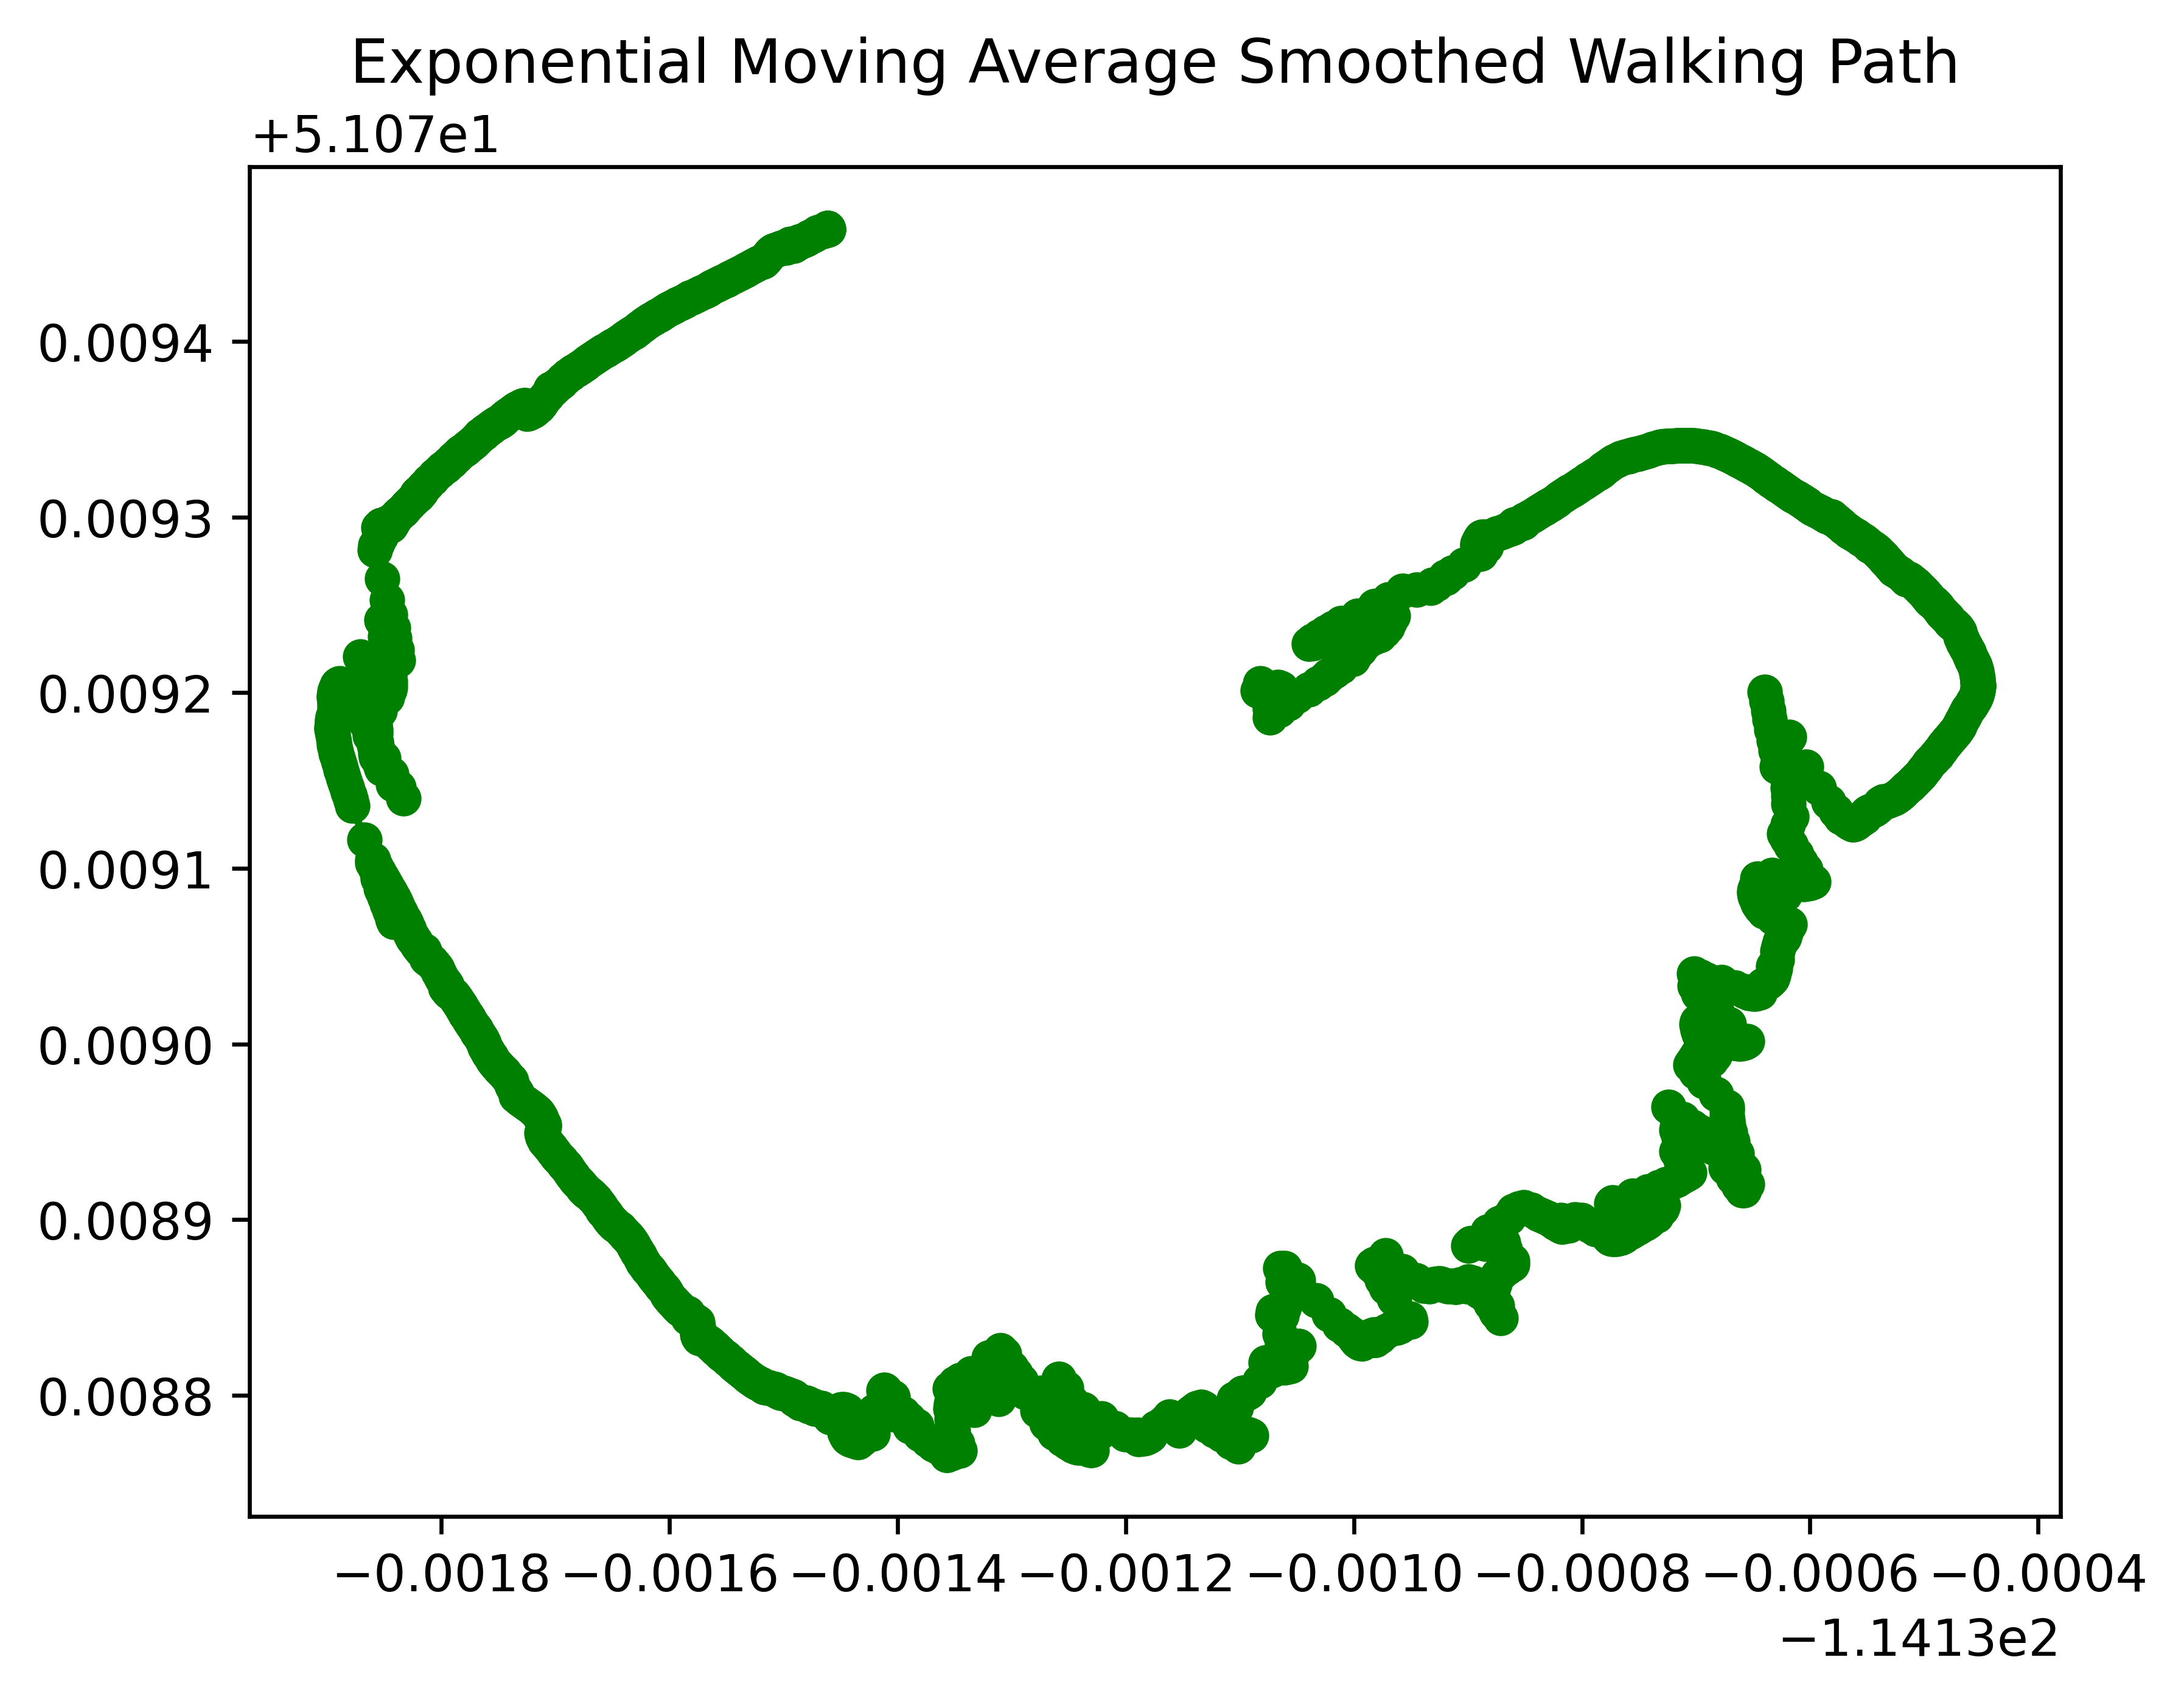
Graph after applying an Exponential Moving Average filter. This gives more weight to the most recent points, and less weight to the older points, this kept the trends intact but still wasn't the most effective smoothing method.
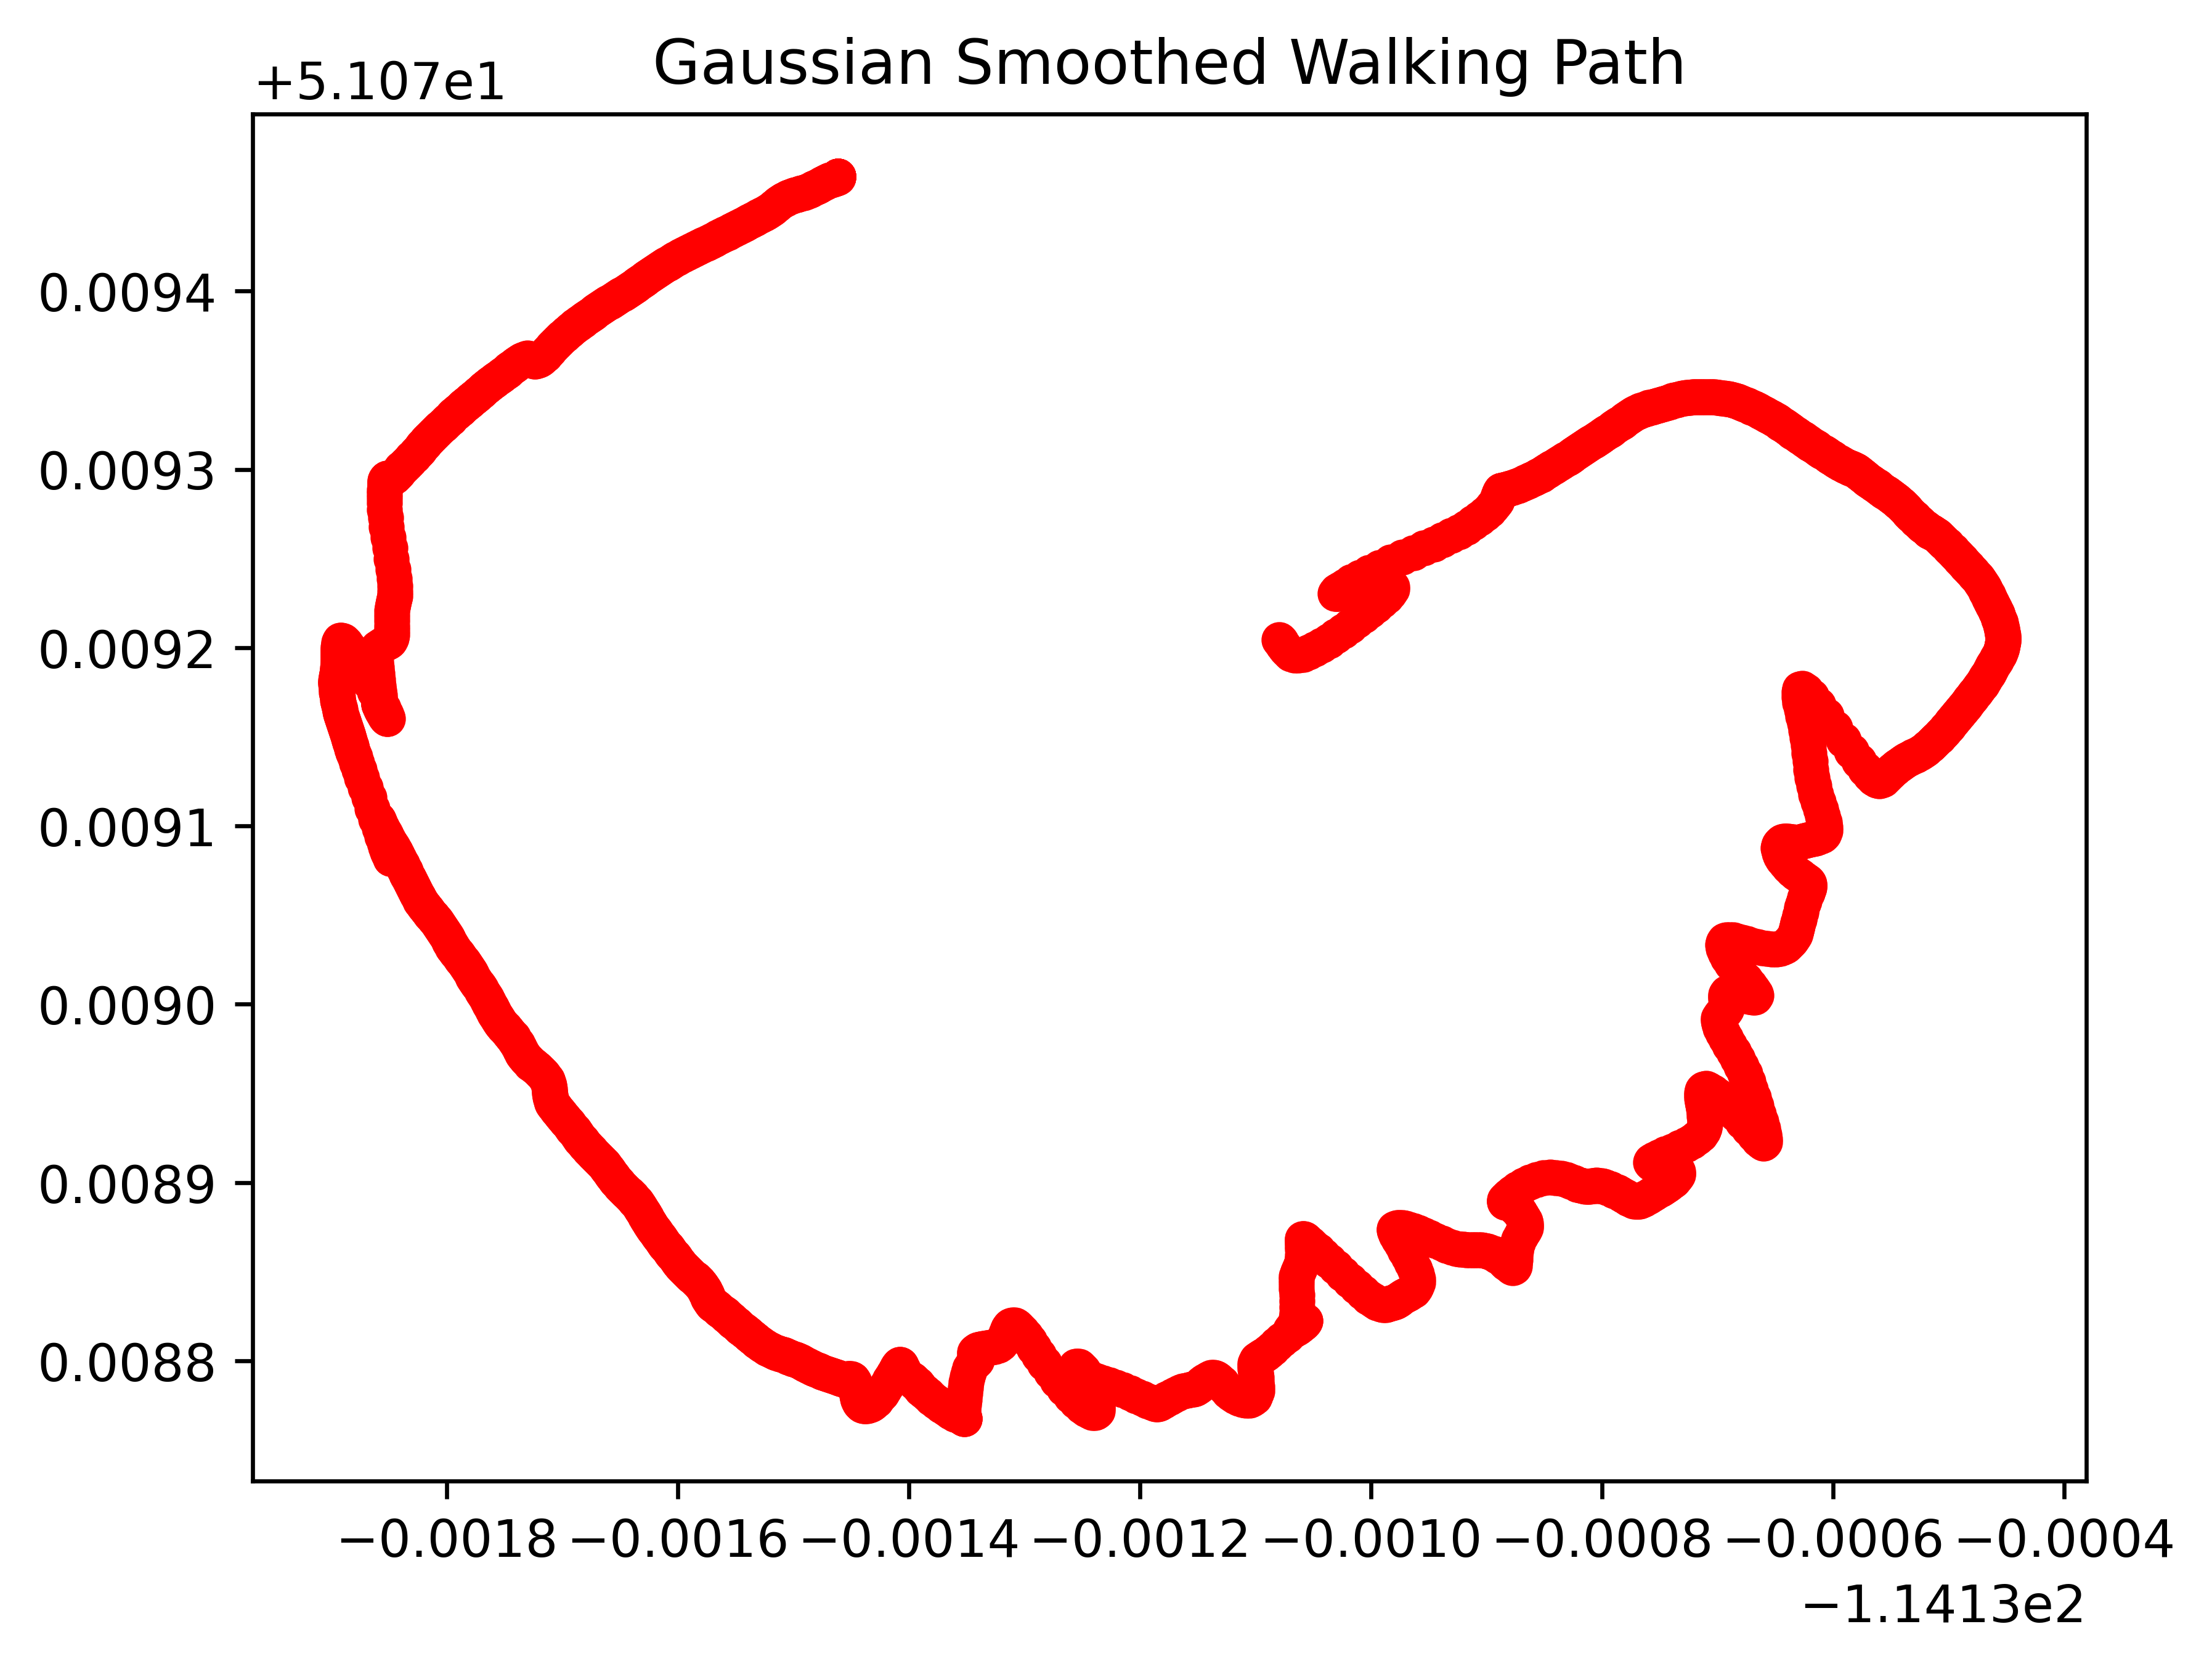
Gaussian smoothing applied to reduce noise while maintaining structure. Is similar to EMA, however the weighting of points follows a bell curve, meaning closer values also have more influence. The strength of smoothing is determined by a factor sigma, which we have set to 4, this gave the best resuls
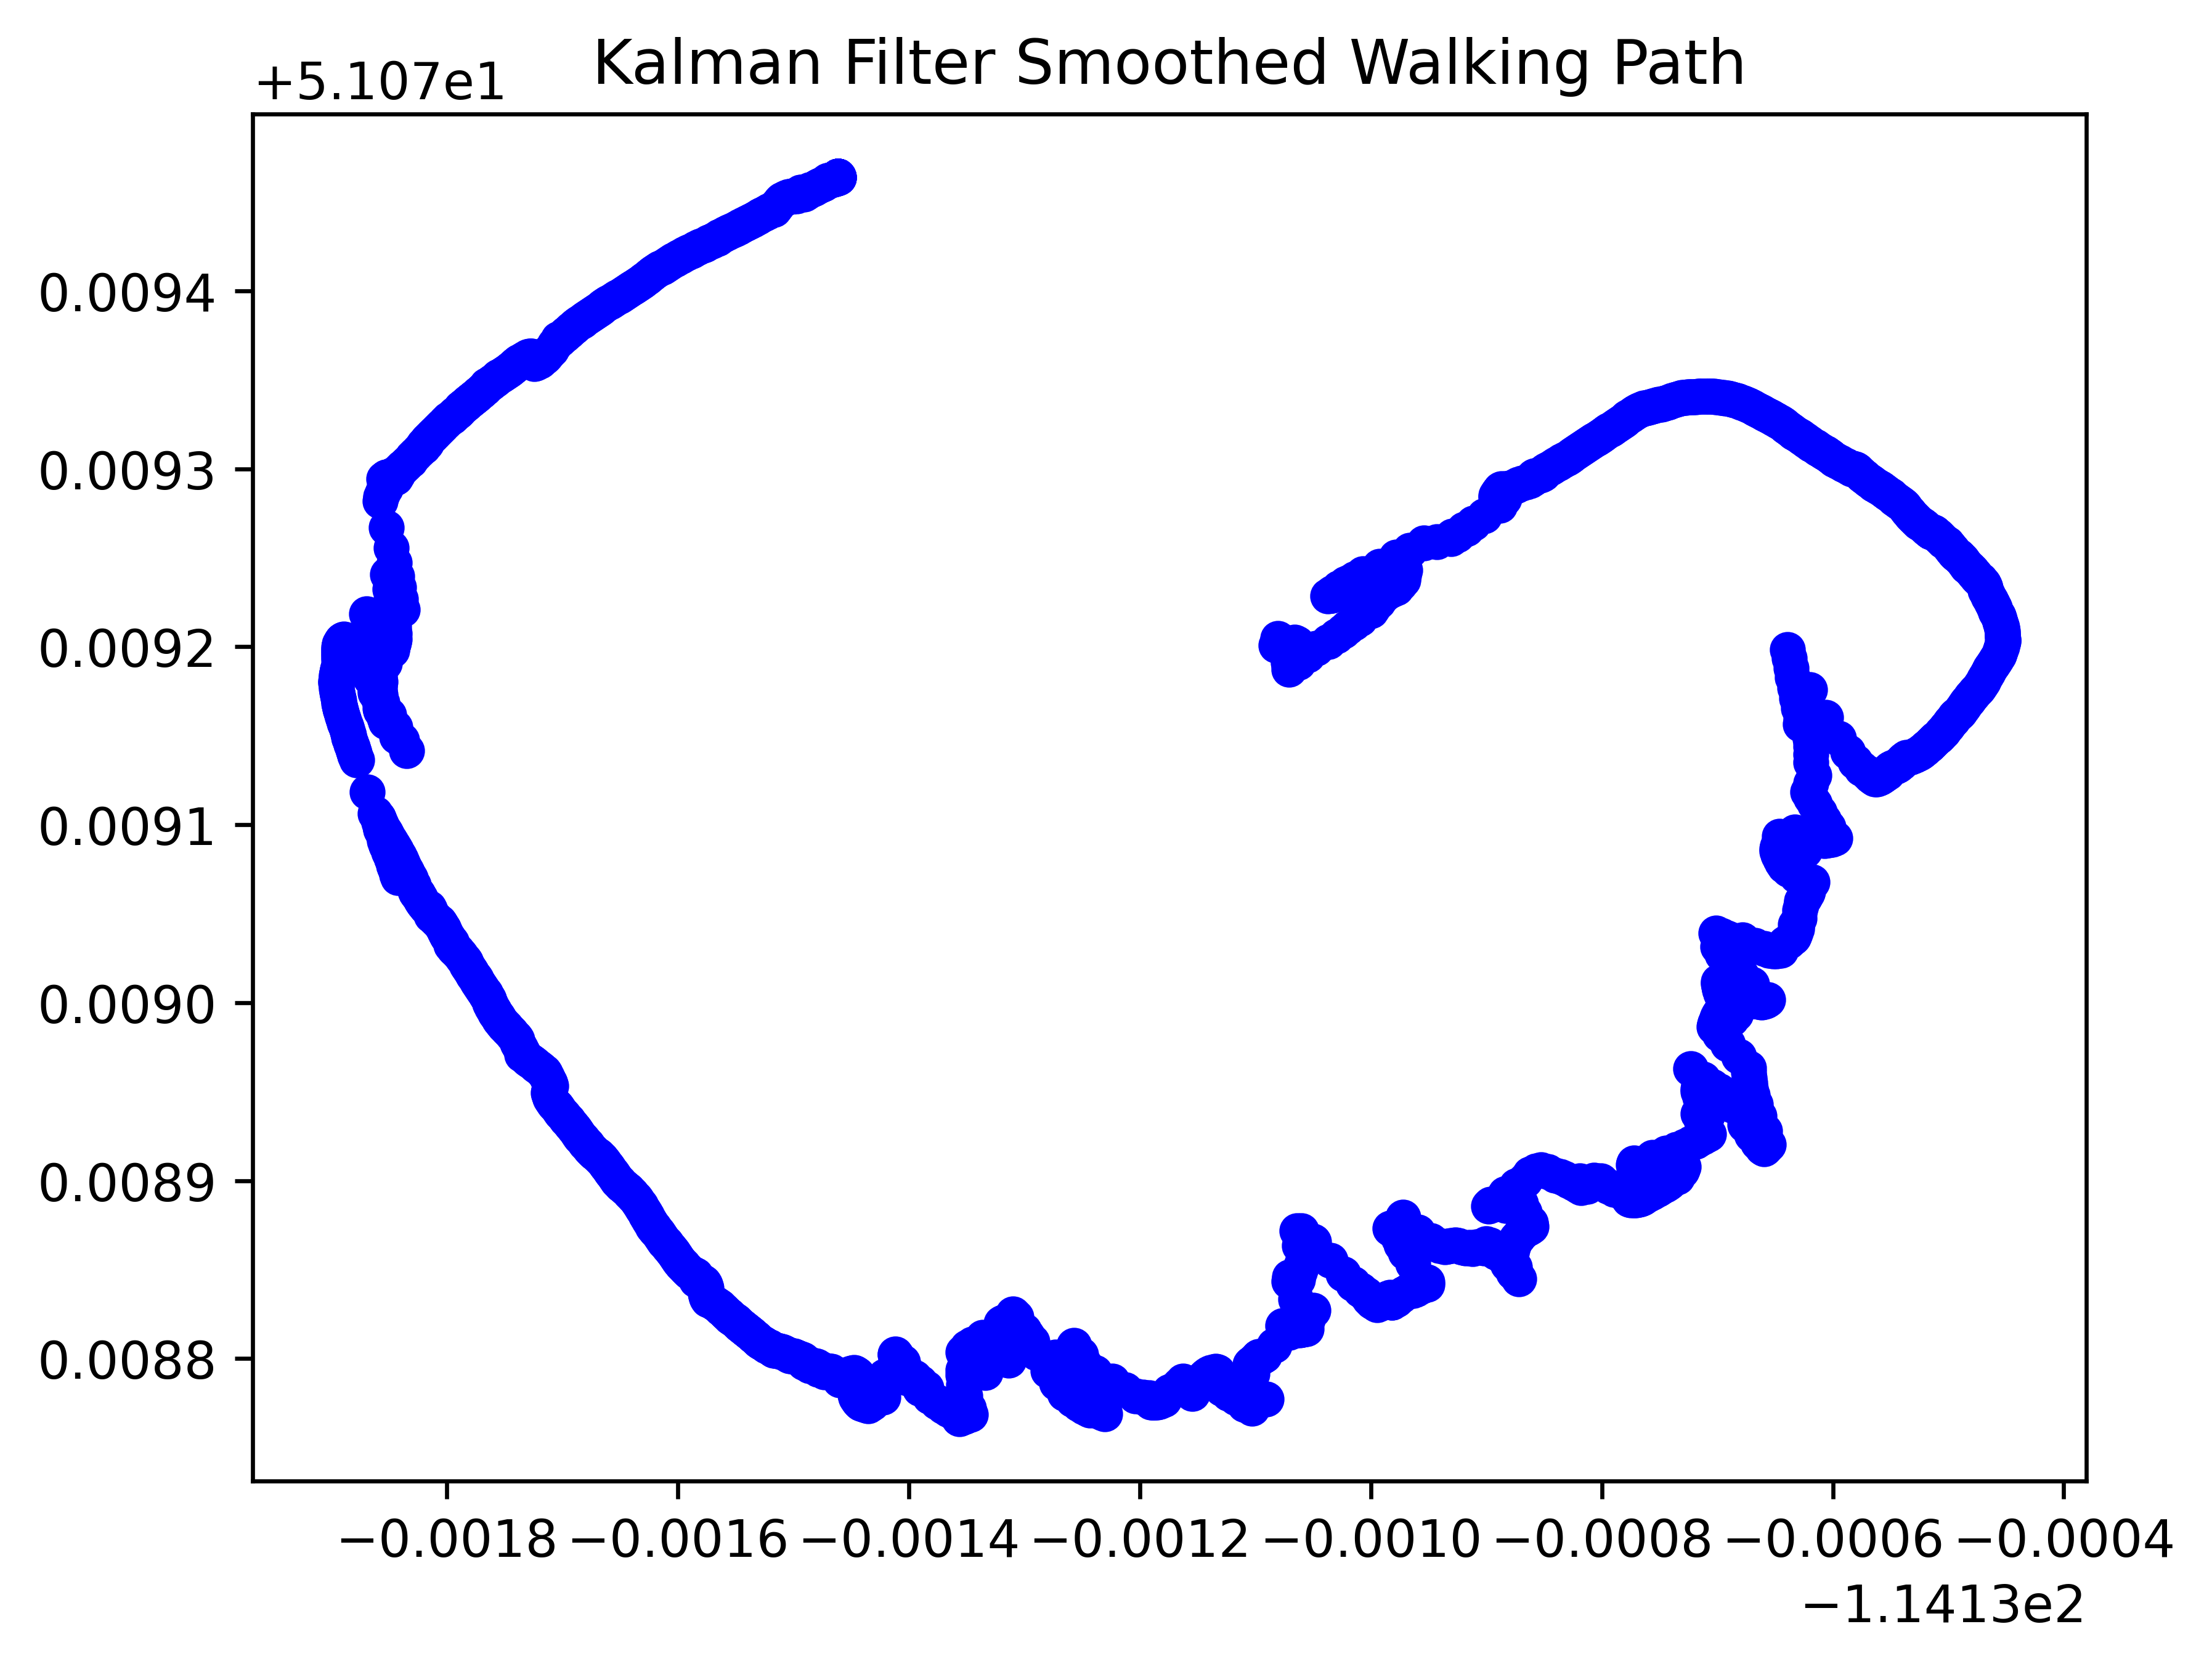
This is the kalman smoothing method, it's more complex but is a common method used in GPS data smoothing. It's a method that uses previous values to predict the next value like extrapolation, and them chooses how trustworthy the prediction is. This ended up giving a similar result to EMA
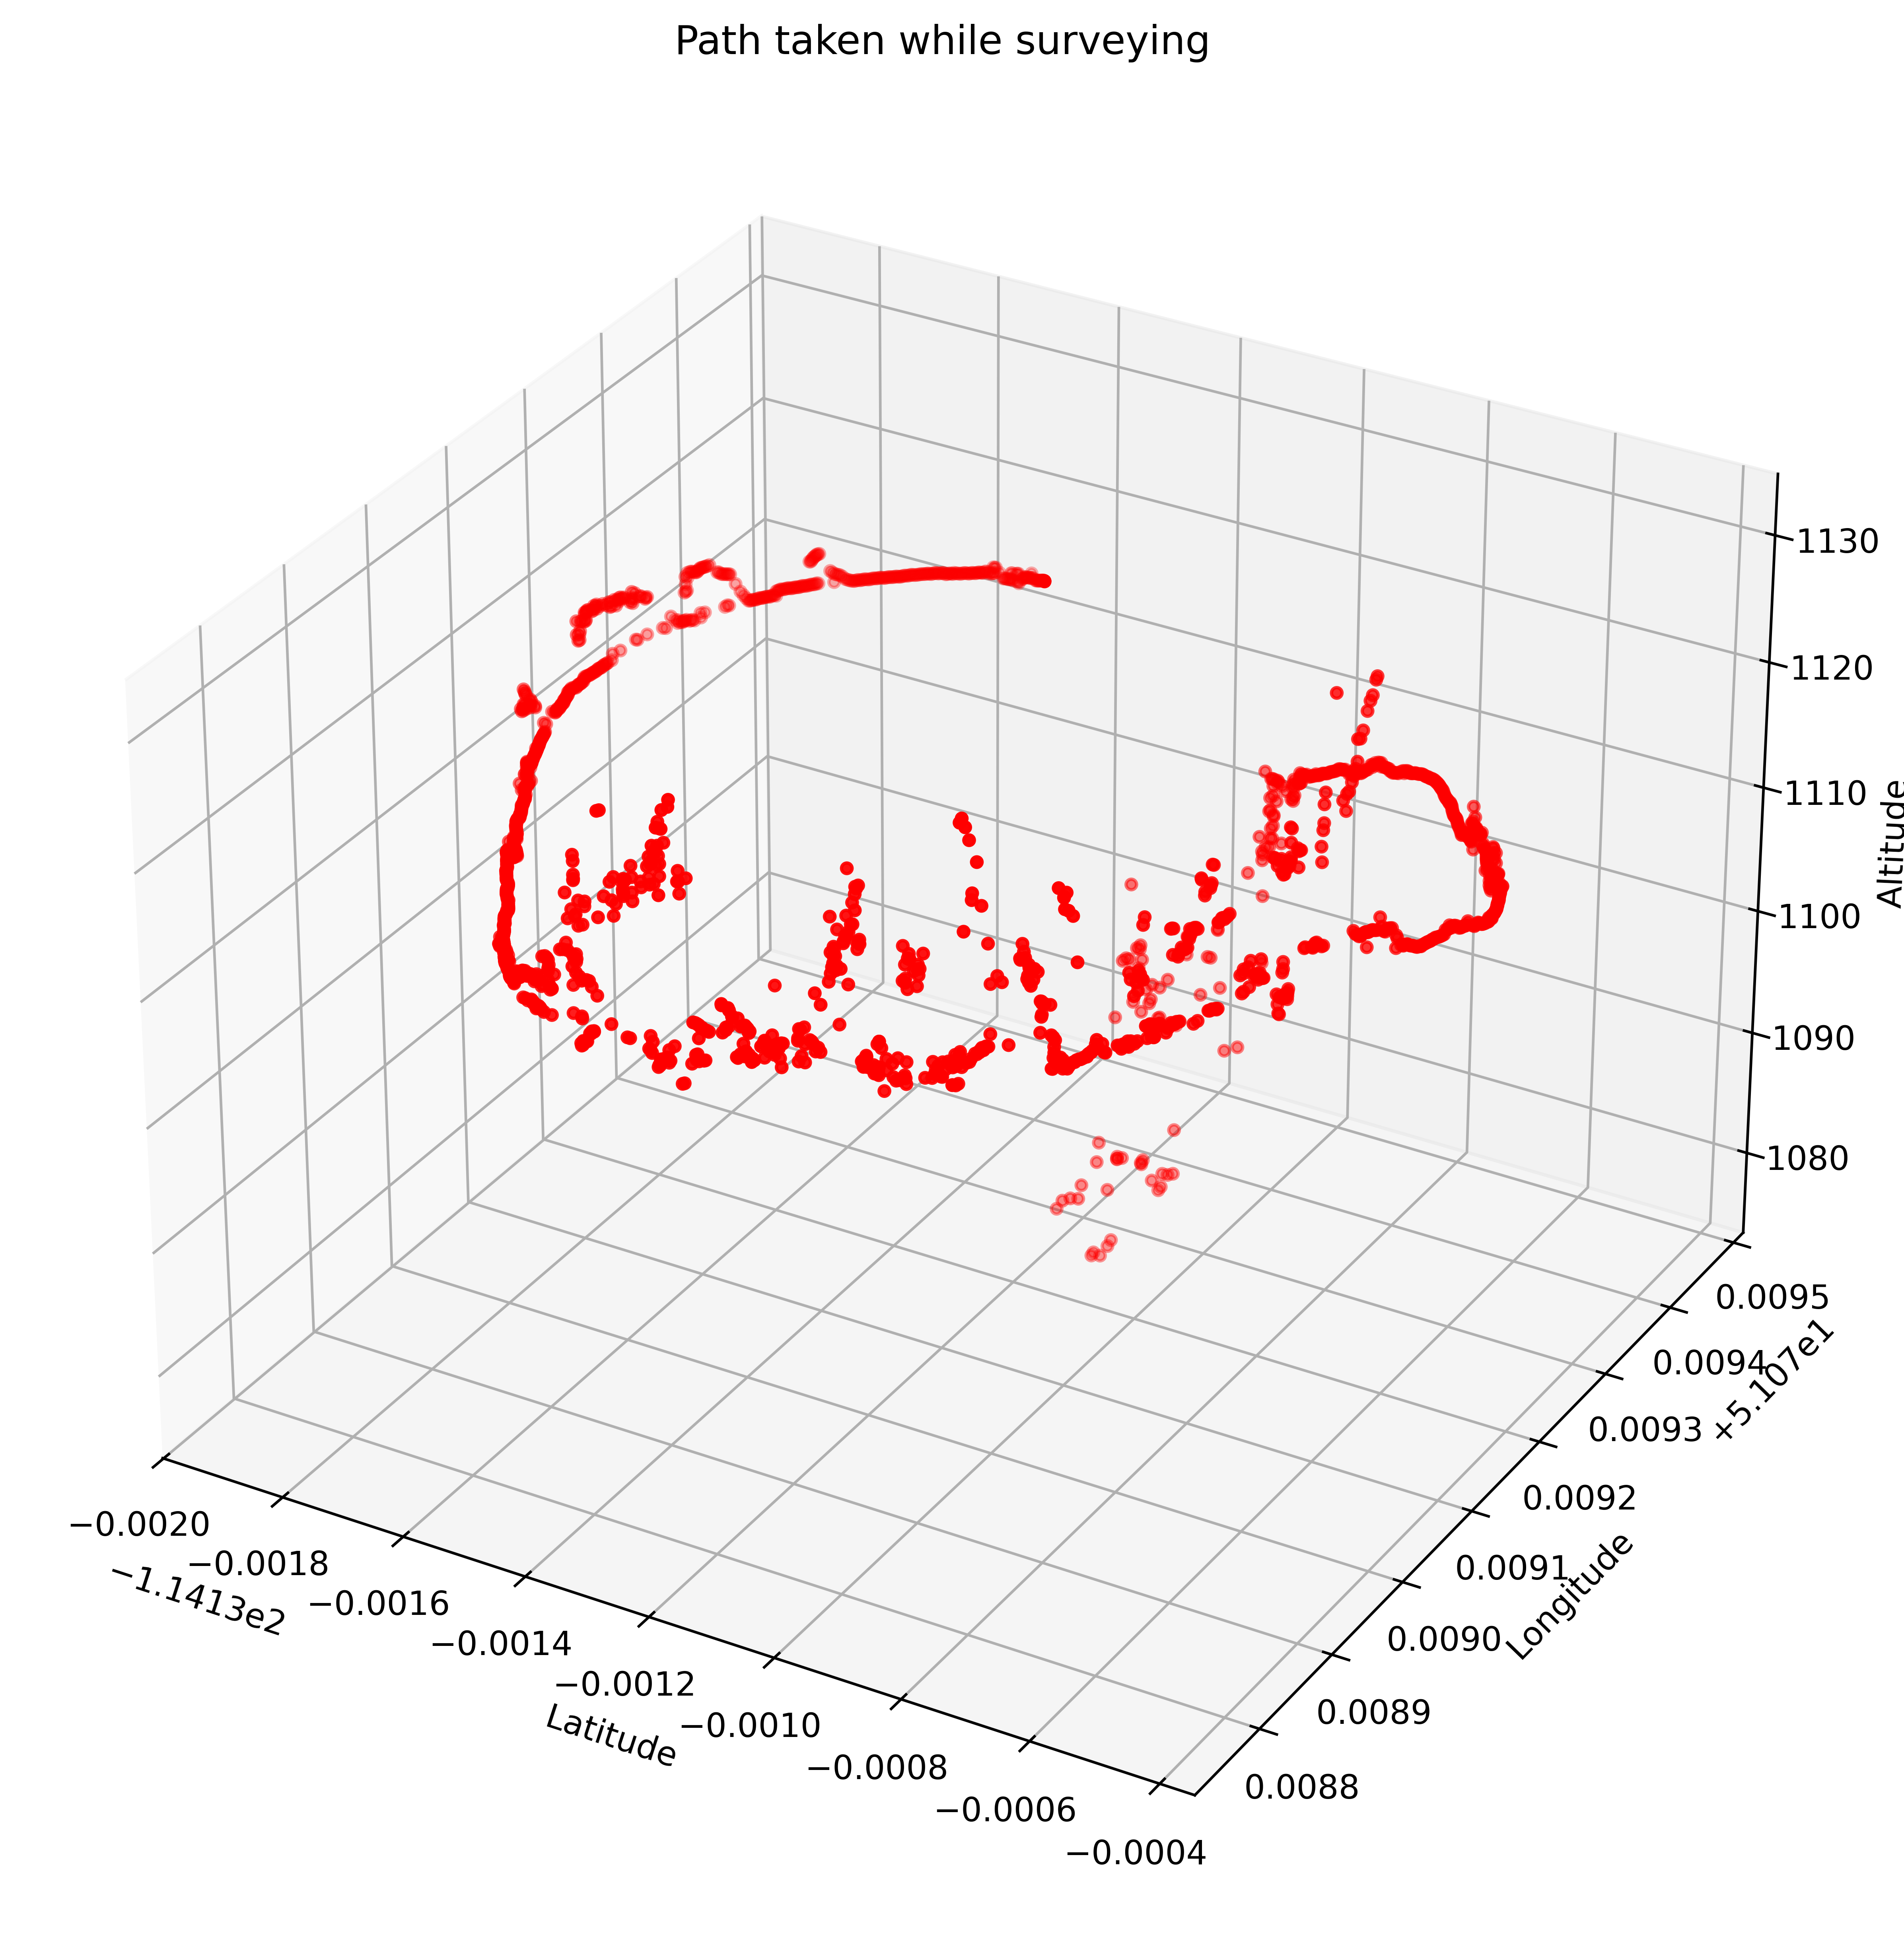
3D representation of the recorded route, including altitude changes. We can see the altitude changes and varies a lot, and this was because of obstructions in the path, this is the raw data.
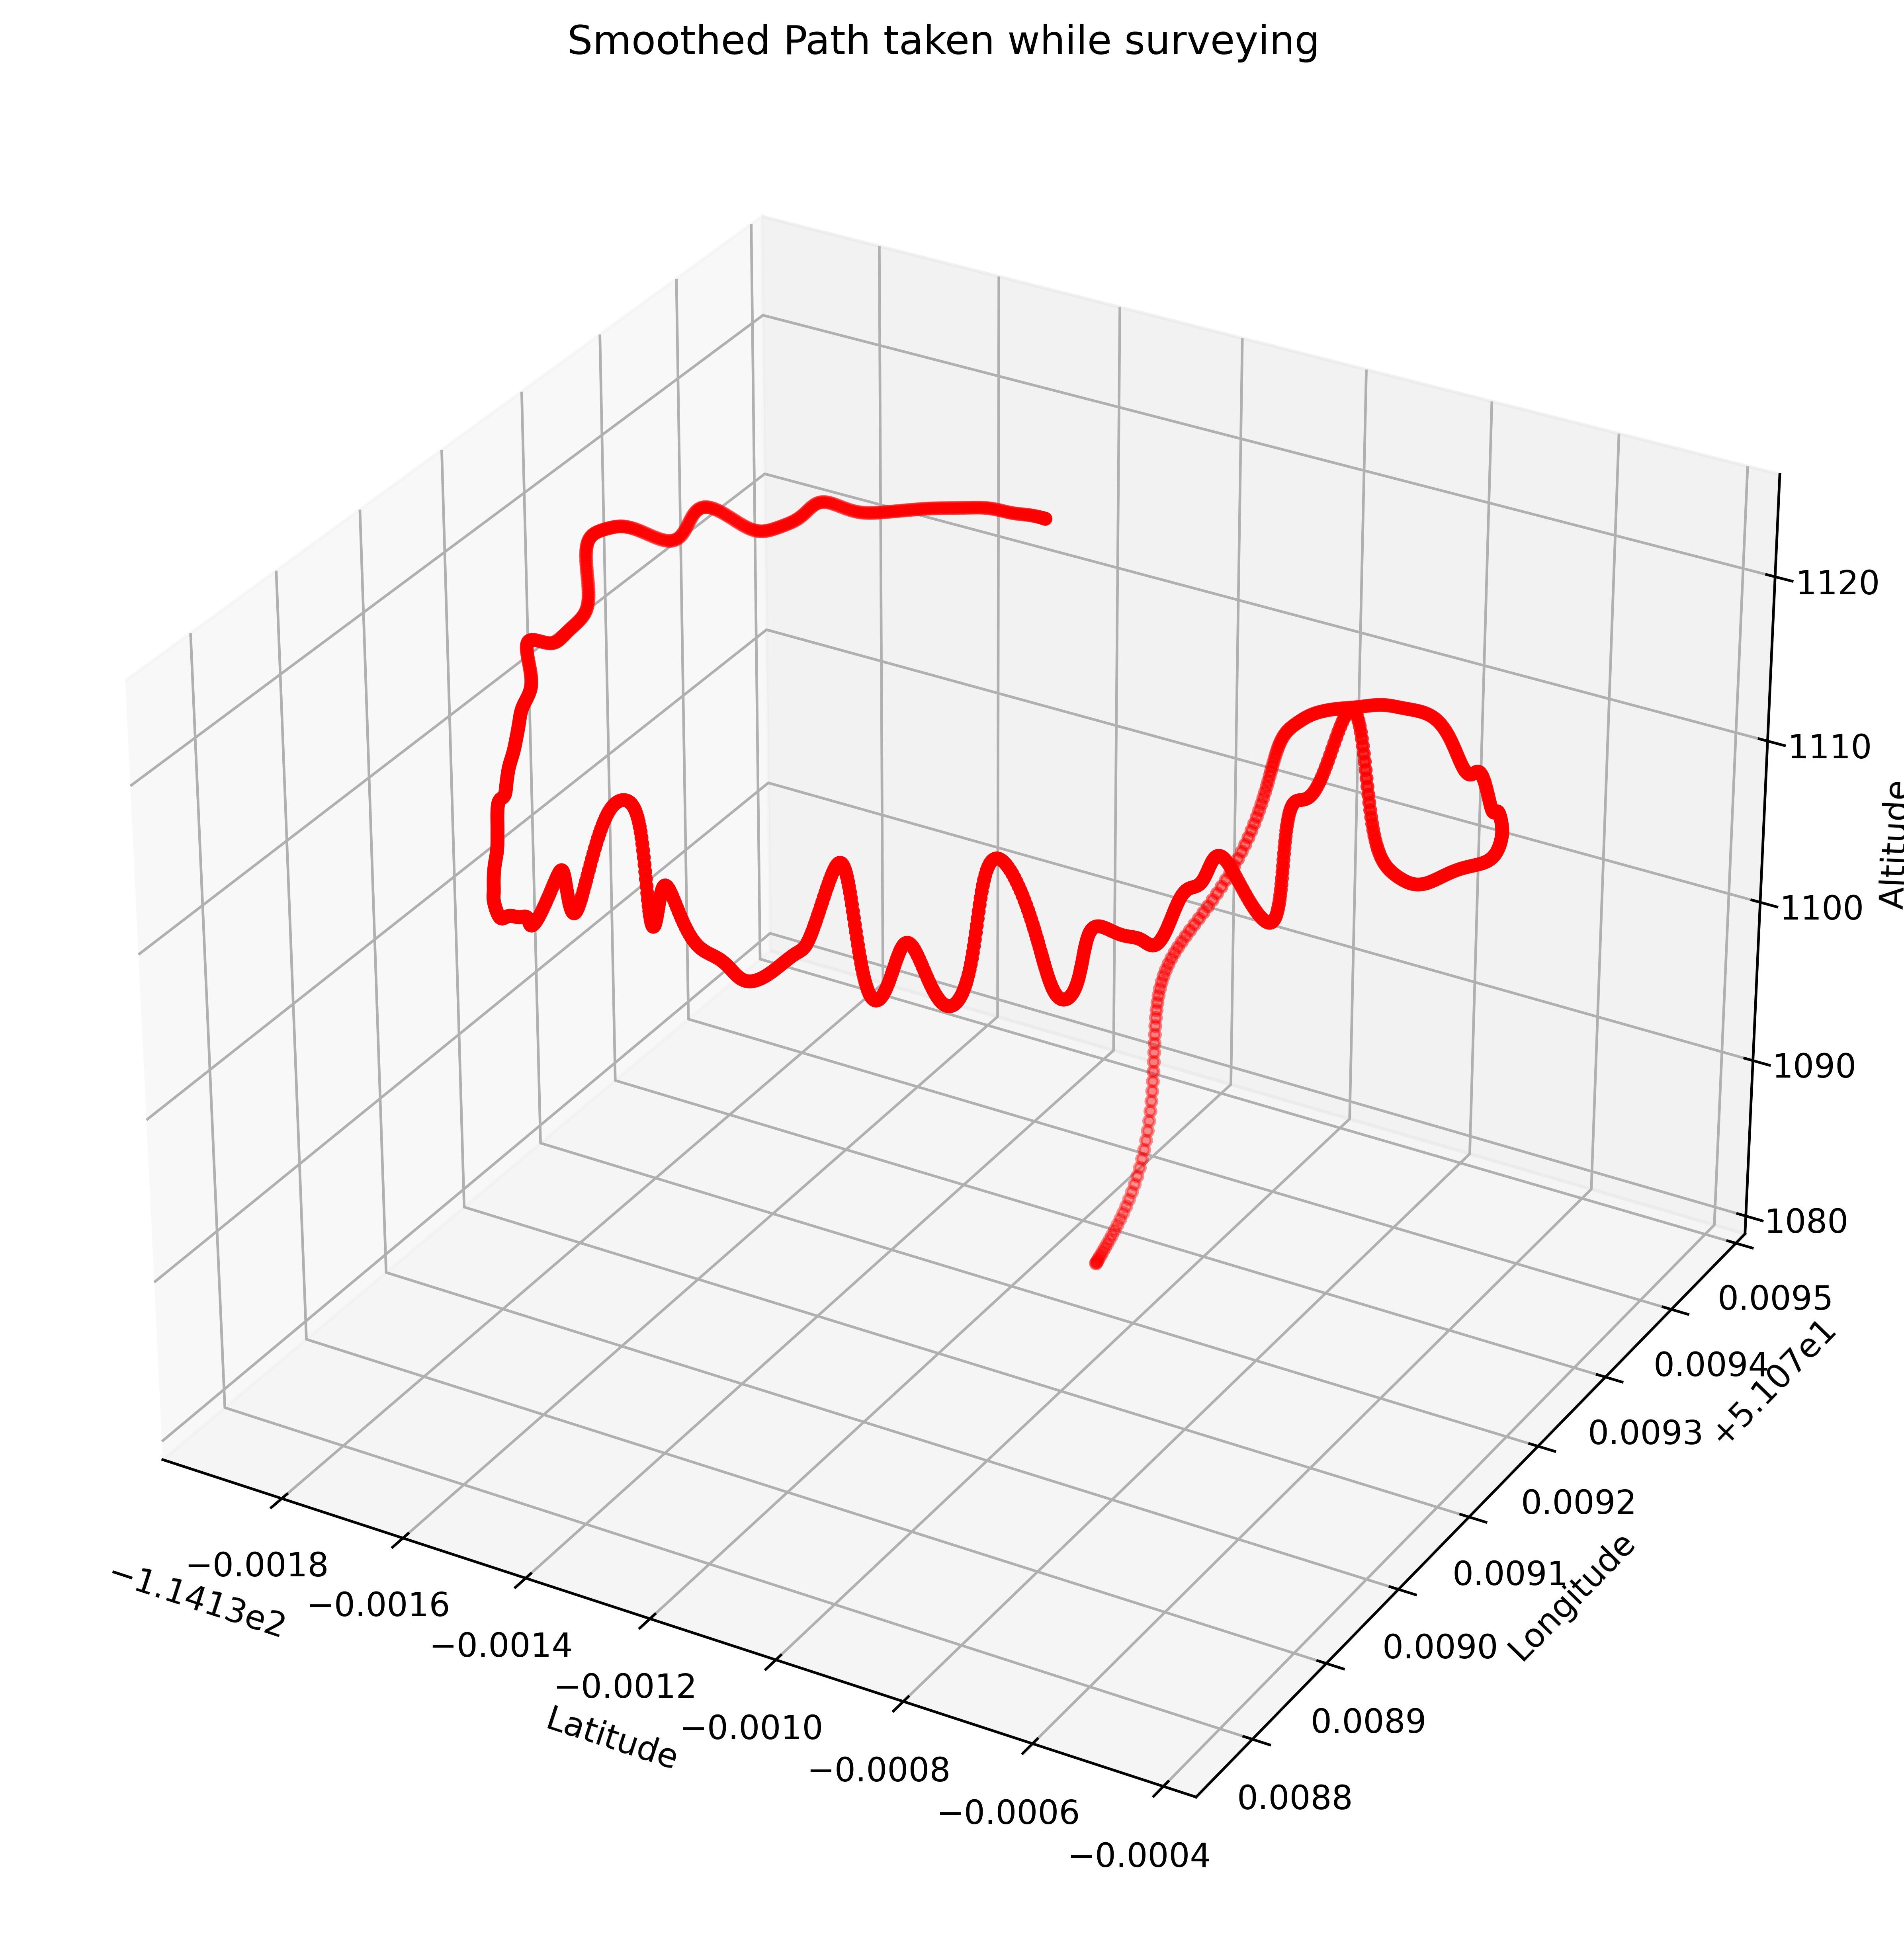
3D representation of the smoothed data, this using the gaussian smoothing method as it was the most effective, with a sigma of 10. The change in altitude at the end is due to the building and us stopping the recording, making it an outlier in the data that should'nt be considered
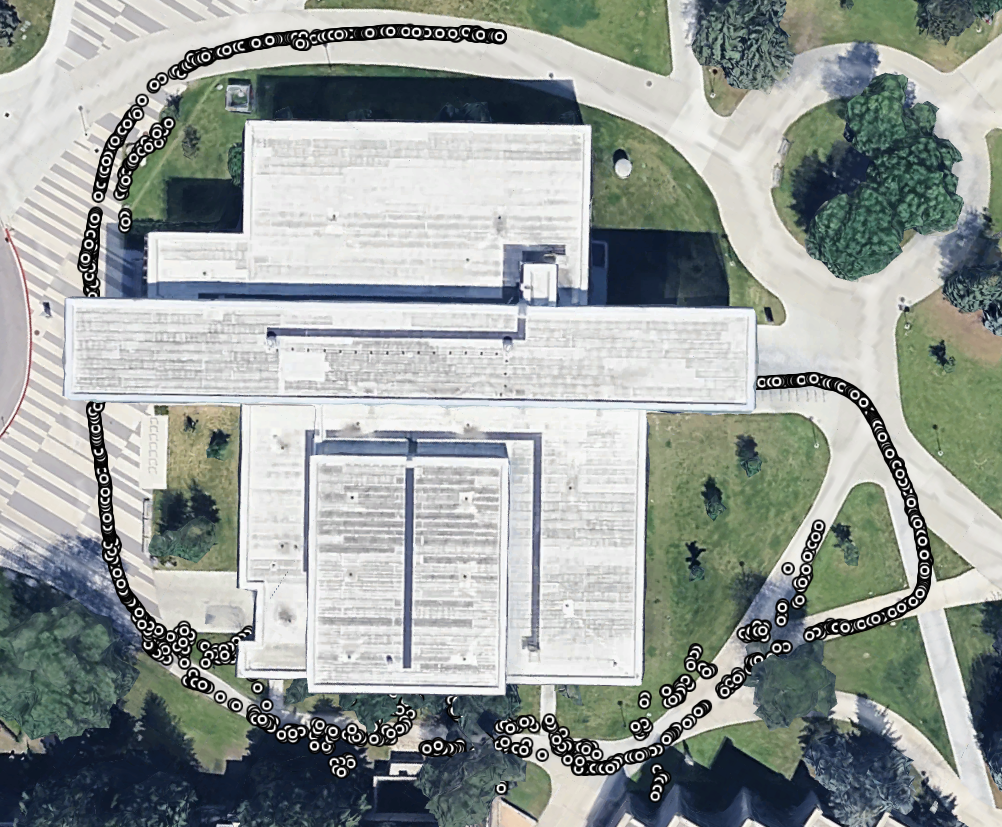
This was mapped out by exporting our data as a csv file, and importing the points into google earth. It clearly shows the points where we had errors and the reasons for them, mainly being the building and walking underneath structures. As well as he paths taken to some extent due to our unsteady walking.